Having fun with Spotipy!
In this post we will explore some of the Spotipy possibilities to retrieve and analyze your streaming data.
Libraries import and authentification
Let’s start by importing the libraries that we are going to use
# write a simple Python function
# libraries import
import numpy as np
import pandas as pd
import matplotlib.pyplot as plt
import seaborn as sns
from dateutil.parser import parse as parse_date

# spotify libraries
import spotipy
from spotipy.oauth2 import SpotifyClientCredentials
from spotipy import util
Next we need to authentificate our user and credentials. To do this, we first create an application in the Spotify Dashboard and gather the credentials. Then it’s easy to initialize and authorize the client:
token = util.prompt_for_user_token(username = user,
                                   scope = 'user-top-read',
                                   client_id= client_id,
                                   client_secret=client_secret,
                                   redirect_uri= 'http://localhost/')

spotify = spotipy.Spotify(auth=token)
spotify.trace = True
spotify.trace_out = True
Tip: In case you are struggling to get the user, client_id and client_secret, I recommend this video and this tutorial to help you configure your app.
Top tracks
The spotify object has several ways to access JSON for artists, songs and songs features. Let’s start by retrieving my top tracks. One way to do it is to define a for loop to parse the data into a tidy dataframe.
top_tracks = spotify.current_user_top_tracks(limit=1000, time_range="long_term") #<-- method to get top tracks
cnt = 1
fields = ['rank_position', 'album_type', 'album_name', 'album_id',
              'artist_name', 'artist_id', 'track_duration', 'track_id',
              'track_name', 'track_popularity', 'track_number', 'track_type']

tracks = {}

for i in fields:
        tracks[i] = []

for i in top_tracks['items']:

    #tracks['rank_position'].append(cnt)
    tracks['album_type'].append(i['album']['album_type'])
    tracks['album_id'].append(i['album']['id'])
    tracks['album_name'].append(i['album']['name'])
    tracks['artist_name'].append(i['artists'][0]['name'])
    tracks['artist_id'].append(i['artists'][0]['id'])
    tracks['track_duration'].append(i['duration_ms'])
    tracks['track_id'].append(i['id'])
    tracks['track_name'].append(i['name'])
    tracks['track_popularity'].append(i['popularity'])
    tracks['track_number'].append(i['track_number'])
    tracks['track_type'].append(i['type'])
    cnt += 1

df = pd.DataFrame(dict([ (k,pd.Series(v)) for k,v in tracks.items() ]))
df
| rank_position | album_type | album_name | album_id | artist_name | artist_id | track_duration | track_id | track_name | track_popularity | track_number | track_type | |
|---|---|---|---|---|---|---|---|---|---|---|---|---|
| 0 | NaN | ALBUM | Principios Basicos De Astronomia | 6wMqAOwrW6E8FkSGBXKGVe | Los Planetas | 0N1TIXCk9Q9JbEPXQDclEL | 142680 | 0oQhYCbyUqieIVsl1zt1q3 | Pesadilla En El Parque De Atracciones | 20 | 11 | track |
| 2 | NaN | ALBUM | The Messenger | 3ZFz6QOM8bF9yjNm5NTjWr | Johnny Marr | 2bA2YuQk2ID3PWNXUhQrWS | 232120 | 6r3eOjeAlA1SRiLMr9vNco | The Crack Up | 17 | 10 | track |
| 4 | NaN | ALBUM | Oshin | 1hSONHeTOofdeh2uoFBLgv | DIIV | 4OrizGCKhOrW6iDDJHN9xd | 127800 | 49cnatGE4zvbt5gP5DISLy | (Druun) | 36 | 1 | track |
| 5 | NaN | ALBUM | Oshin | 1hSONHeTOofdeh2uoFBLgv | DIIV | 4OrizGCKhOrW6iDDJHN9xd | 165840 | 76MJsF1rbbhrv2tDBfeRR5 | Follow | 38 | 9 | track |
| 6 | NaN | ALBUM | Sugar Tax | 1J8e1dLKVmZbsyxpGa9lGg | Orchestral Manoeuvres In The Dark | 7wJ9NwdRWtN92NunmXuwBk | 249173 | 4NsNi4w10Tkpv6uikyXbJ6 | Pandora's Box | 53 | 2 | track |
| 7 | NaN | ALBUM | Shapeshifting | 3DyIAjq1iOl07Z1IV39Py6 | Young Galaxy | 5xfJLyvC5UElVSiMuLt1ss | 32373 | 6UvfReXhIyTime6acIlHzc | NTH | 0 | 1 | track |
| 8 | NaN | ALBUM | Antics | 58fDEyJ5XSau8FRA3y8Bps | Interpol | 3WaJSfKnzc65VDgmj2zU8B | 215826 | 6B182GP3TvEfmgUoIMVUSJ | Evil | 63 | 2 | track |
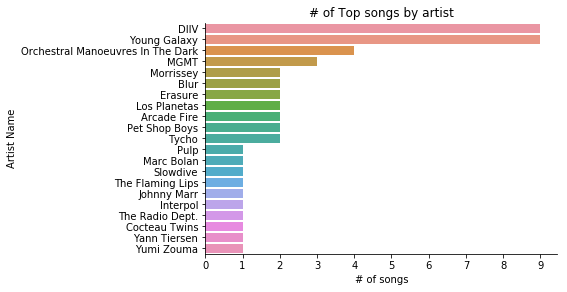
Now that we have tidy data, let’s analize the number of songs by artist
artists = pd.DataFrame(df.groupby('artist_name')['track_name'].count().sort_values(ascending = False).reset_index())
sns.catplot(x = 'track_name', y = 'artist_name', data = artists, kind = 'bar', height = 7, aspect = 1 );
plt.title("# of Top songs by artist")
plt.xlabel('# of songs')
plt.ylabel('Artist Name')
plt.xticks(np.arange(0, 10, step=1));

What’s the average length of the songs I listen to?
# Average and median length of songs
avg_duration_sec = round(np.mean(df['track_duration'] / 1000), 2)
avg_duration_min = round(avg_duration_sec / 60, 2)
median_duration_sec = round(np.median(df['track_duration'] / 1000), 2)
median_duration_min = round(median_duration_sec / 60, 2)

print('The average length of top tracks is ' + str(avg_duration_sec) + ' seconds -- ' + str(avg_duration_min) + ' minutes')
print('The median length of top tracks is ' + str(median_duration_sec) + ' seconds -- ' + str(median_duration_min) + ' minutes')
What’s the average popularity of the songs?
# Average and median popularity of songs
avg_popularity = round(np.mean(df['track_popularity']), 2)
median_popularity = round(np.median(df['track_popularity']), 2)


print('The average popularity of top tracks is ' + str(avg_popularity))
print('The median popularity of top tracks is ' + str(median_popularity))
Audio Features
The audio features are characteristics that Spotify assigns to the songs. Some of them are really straightforward (tempo, loudness) and others not that much (instrumentalness). You can read more on the API reference.
# Get audio features from top tracks and analysis
df = df.loc[df['track_id'] != '4BSP1PK4sLlticRfYl1M79',:] # drop track that's not a song
features = spotify.audio_features(tracks = df['track_id'])

# Build df from dictionary and merge
def get_features(result):
    danceability = []
    key = []
    loudness = []
    mode = []
    speechiness = []
    acousticness = []
    instrumentalness = []
    liveness = []
    valence = []
    tempo = []
    track_id = []
    t = 0
    for i in result:
        danceability.append(i['danceability'])
        key.append(i['key'])
        loudness.append(i['loudness'])
        mode.append(i['mode'])
        speechiness.append(i['speechiness'])
        instrumentalness.append(i['instrumentalness'])
        liveness.append(i['liveness'])
        valence.append(i['valence'])
        tempo.append(i['tempo'])
        track_id.append(i['id'])
    return pd.DataFrame({'danceability' : danceability, 'key' : key, 'loudness' : loudness, 'speechiness' : speechiness,
                          'instrumentalness' : instrumentalness, 'liveness' : liveness, 'valence' : valence,
                          'tempo' : tempo, 'track_id' : track_id})
    features_df = get_features(features)
# merge dataframes
songs_and_features = pd.merge(df, features_df, left_on = 'track_id', right_on = 'track_id')
songs_and_features
Let’s go ahead and plot danceability of the artists with more than 1 song in the list.
Turns out I’m not that bad… I was expecting a much darker outcome ![]()
Top Artists
With the method .current_user_top_artists() you can retrieve your top artists and some info about them. Applying the same methods than before we get the following df:
Get top tracks from an artist
I wanna finish this post with a way of getting top tracks from any artist you want. You only need the spotify uri that identifies each artist.
# Diiv Example
lz_uri = 'spotify:artist:4OrizGCKhOrW6iDDJHN9xd'

spotify = spotipy.Spotify(client_credentials_manager=credentials)
results = spotify.artist_top_tracks(lz_uri)

for track in results['tracks'][:10]:
    print('track    : ' + track['name'])
    print('audio    : ' + track['preview_url'])
    print('cover art: ' + track['album']['images'][0]['url'])
    print()
Tip: If you want to improve your analysis it’s better to Download your privacy data from Spotify. It’s an easy process but it takes a few days to complete. Once it’s done, they will send you an alert to your email with the instructions to analyze the data.
Extras
- Repo of the project.
- 2 great songs that keep coming to my mind in these odd, strange days that we are living.


